Access the Inventory Report by selecting SellerPulse in the top navigation and hovering over the menu on the left. Click on Reports and choose Inventory Report.
The Inventory Report has four tabs: the Inventory Planning Summary, the Plan Inventory tab, the Low Inventory Level Fee tab, and the Aged Inventory Surcharge tab. Scroll down or click these anchor links for details about the features on each page, use cases, and FAQs.
You can also receive a weekly email summary of key inventory metrics across your catalog. The FBA Inventory Planning Report can be used to plan inventory replenishment and monitor low-inventory-level fee and aging inventory charges.
Inventory Planning Summary
The Dashboard includes sections summarizing your inventory's current status, sales, days of supply, the number of SKUs that are incurring additional charges based on inventory level, and recent stockouts.

Inventory Summary
- Fulfillable units: the total number of units at FBA that have a status of "fulfillable," meaning they can be shipped to buyers.
- Inbound units – Working, Shipped, and Received: the total number of units that are being shipped to an Amazon Fulfillment Center, broken down by those that are included in a shipment you are still putting together, those in shipments that have been shipped, and those that an Amazon Fulfillment Center has received but not made eligible for shipment to buyers yet.
- Unfulfillable units: units at FBA that are marked as "unfulfillable" by Amazon, which can happen for a variety of reasons. These are not eligible to be shipped to buyers.
- Reserved units: units that are marked as "reserved" by Amazon, which usually means they are included in pending orders from buyers or that they are being transferred from one Fulfillment Center to another.
Sales Summary
- Units sold: the total number of units sold to buyers in the past 7, 30, and 90 days.
- Unique SKUs sold: the number of different products (based on your SKUs) sold to buyers in the past 7, 30, and 90 days.
Days of Supply
Amazon calculates how many days' worth of inventory you have at FBA for each SKU based on current inventory quantities and recent sales velocities. This section imports Amazon's Days of Supply metric and then shows the number of SKUs currently in each bucket: 0-7 days of supply, 7-30 days of supply, 30-90 days of supply, and 90+ days of supply.
Low-Inventory-Level Fee
Amazon also calculates a Historical Days of Supply metric for each SKU on a weekly basis. If the Historical Days of Supply metric falls below 28 days, Amazon adds a low-inventory-level fee to subsequent sales until the days of supply increases again. This section shows you how many SKUs are currently incurring the charge. For more data on historical days of supply and low-inventory-level fees, see the Low Inventory Level Fee tab.
Aged Inventory Surcharge
Units that have been in an Amazon Fulfillment Center for more than 180 days incur an extra storage fee per cubic foot of space they take up in the Fulfillment Center, in addition to regular monthly storage fees. This section shows how many units have been at FBA for more than 180 days and an estimate of the fees that will be incurred this month as a result. For more data on aging inventory units and surcharges, see the Aged Inventory Surcharge tab.
Recent Stockouts
This section shows the number of SKUs that have recently gone out of stock (within approximately the past week) and a list of the particular SKUs. In this report, a recent stockout is defined as a SKU where the current Amazon fulfillable quantity is zero and units sold in the last seven days is greater than zero.
You can export this table as a CSV:
- Hover within the table.
- Click the ellipsis (...) icon above the top right corner.
- Click "Export Data."
- Choose "Data with Current Layout."
Tip: You can receive a weekly email with a summary of your inventory, sales, SKUs by days of supply, recent stockouts, low-inventory-level fees, and aged inventory surcharge information. Enable it on the SellerPulse dashboard in the Inventory section.
Plan Inventory
This page allows you to manipulate data about your inventory to help you decide what to replenish or discontinue and any other actions you may want to take.
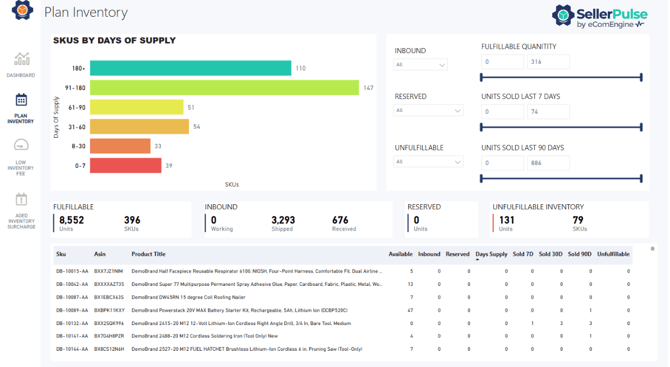
SKUs by Days of Supply
This color-coded graph shows you how many SKUs are in each Days of Supply range: 180+, 91-180, 61-90, 31-60, 8-30, and 0-7. Click each bar to filter the SKU table by that Days of Supply range and easily identify SKUs that may need to be replenished.
SKU Table
The table displays each of your FBA SKUs along with its ASIN; title; number of units that are available, inbound, and reserved; days of supply; units sold in the last 7, 30, and 90 days; and number of units that are unfulfillable. The table also includes AWD Onhand, which is the total onhand quantity of units in the Amazon AWD distribution centers.
Click each column header to sort the table by the number in that column. For example, you can sort by fewest days of supply or by greatest number of units sold in the last 30 days.
You can also export the table as a CSV:
- Hover within the table.
- Click the ellipsis (...) icon above the top right corner.
- Click "Export Data."
- Choose "Data with Current Layout."
Filters
The whole Plan Inventory page can be filtered using the drop-downs and sliders at the top right:
- Inbound, Reserved, and Unfulfillable drop-downs: select a number (or numbers) of units from 0 upwards to display data about SKUs that have that number of units in this status.
- Fulfillable Quantity, Units sold last 7 days, and Units sold last 90 days sliders: use these to select a range and display data about SKUs that have that amount of inventory fulfillable or sold.
Low Inventory Level Fee
This page allows you to see details about which SKUs are incurring the low-inventory-level fee and their historical days of supply (HDOS) metrics.

SKUs by Historical Days of Supply
This graph shows you how many SKUs are in each Historical Days of Supply range, from 0-14 up to 180+. Red bars indicate that the SKUs are at risk of incurring the low-inventory-level fee, which is applied if the Historical Days of Supply metric falls below 28 days and the SKU is not exempt from the fee. Blue bars indicate that the SKUs are currently safe from this fee.
Fee Reference Table
For convenience, Amazon's low-inventory-level fees are described here for reference. Fees are higher for SKUs with a heavier shipping weight and for SKUs with a lower Historical Days of Supply metric.
SKU Table
The table displays FBA SKUs along with:
- Historical Days of Supply (HDOS): a metric imported from Amazon which they use to determine which SKUs incur this fee.
- Incurring fee: a field imported from Amazon showing whether this SKU is currently incurring the low-inventory-level fee. A value of N/A means Amazon is not providing a Yes or No for this field.
- Note: This field is only available in the US and Canada marketplaces; other marketplaces will always show N/A.
- Exempt from fee: a field imported from Amazon showing whether this SKU is exempt from incurring the low-inventory-level fee because it is new to FBA, has sold fewer than 20 units in the past seven days, or other reasons, or is not exempt. A value of N/A means Amazon is not providing a Yes or No for this field.
- Note: This field is only available in the US and Canada marketplaces; other marketplaces will always show N/A.
- Available, inbound, and reserved units: the number of units of this SKU that are available for purchase at FBA, on their way to a Fulfillment Center, or in a Reserved status (meaning they are being transferred from one Fulfillment Center to another, or are included in pending customer orders).
- Days of supply: the number of available units divided by average sales per day (different from Historical Days of Supply).
- Units sold in the last 7, 30, and 90 days.
- AWD Onhand The table also includes AWD Onhand, which is the total onhand quantity of units in the Amazon AWD distribution centers.
The SKU table can be sorted by any of these columns or filtered by clicking the bars in the graph above. It can also be downloaded as a CSV:
- Hover within the table.
- Click the ellipsis (...) icon above the top right corner.
- Click "Export Data."
- Choose "Data with Current Layout."
Aged Inventory Surcharge
This tab displays data about the SKUs that are incurring the Aged Inventory Surcharge, which Amazon charges (in addition to regular FBA fees) on units that have stayed in a Fulfillment Center for more than 180 days. (This fee was formerly called the long-term storage fee.) The page also estimates the Aged Inventory Surcharge amounts to help you take action on SKUs that are costing you the most in this fee.

Aged Inventory Summary
These numbers summarize the number of SKUs and units incurring this fee and the total estimated fees for this month, as well as the number of units in each age bracket, from 181-210 days up to 365+ days. (Different age brackets incur different amounts for the Aged Inventory Surcharge.)
Click any of these numbers to filter or sort the SKU table below.
SKU Table
The SKU table on this tab lists your FBA SKUs along with:
- Age brackets: how many units are in each age bracket for this SKU
- Total units: total units in all the age brackets that are incurring the fee
- Estimated fees: the estimated total Aged Inventory Surcharge for this SKU this month
As with the other SKU tables, this table can be downloaded as a CSV:
- Hover within the table.
- Click the ellipsis (...) icon above the top right corner.
- Click "Export Data."
- Choose "Data with Current Layout."
Use Cases for the Inventory Report
Inventory Replenishment To-do List
See top-selling SKUs that are very low in stock and need to be replenished urgently.
- First, filter the Plan Inventory page (including the SKU table) by clicking the red 0-7 day bar in the "SKUs by Days of Supply" graph, so you're only seeing SKUs that are either out of stock already or getting close.
- Then, filter out SKUs that already have units on the way to FBA by setting the Inbound Quantity drop-down to 0. This prevents you from sending unnecessary, duplicate shipments.
- If desired, sort the now-filtered SKU table by 90-day sales, greatest to least, so that you can prioritize your best-selling ASINs that meet the other criteria.
Promotions List
Find SKUs that have plenty of stock but are selling slowly so that you can promote them with advertising, coupons, etc. This can help you increase sales overall and avoid or reduce the aged inventory surcharge.
- Sort the SKU table on the Aged Inventory Surcharge page by total units, greatest to least, then by estimated fees, greatest to least. (These may or may not be the same list of SKUs, but both will give you valuable insights.)
- Next, filter the Plan Inventory page for SKUs with more than 180 days of supply by clicking the green 180+ bar in the "SKUs by Days of Supply" graph. These are the SKUs most likely to have individual units that remain at FBA for more than 180 days and incur the aged inventory surcharge soon.
- See which of these SKUs are selling the slowest by sorting the SKU table by 90-day sales, least to greatest.
Removal Lists
Find SKUs that might need to be removed from FBA, if promotions can't move the units fast enough and removal orders won't cost too much. Submit removal orders in order of priority to address the biggest profit leaks first. This can help avoid more aged inventory surcharge fees and save your FBA capacity for better-selling products.
- See SKUs that are costing you the most by sorting the SKU table on the Aged Inventory Surcharge page by estimated fees, greatest to least. (If desired, download this list for easy reference.)
Then, see the SKUs with the oldest units by sorting the SKU table. You can do so by clicking on 365+ Days above the table, which shows you SKUs with any units older than 365 days, sorted by number of units in that age bracket. Again, if promotions aren't able to move these oldest units, it may be time to remove the SKU from FBA to avoid losing more money on it.
Other FAQs
How often is data updated?
This report is based on Amazon's FBA Manage Inventory Health Report, which is generated every few days. We retrieve this report from Amazon twice per day to ensure that we are always showing you the latest version.
How is this different from RestockPro?
SellerPulse gives you insights into your inventory's current state, which may help you make better inventory decisions. However, it does not offer suggested restock quantities or assist with managing purchase orders and shipments.
RestockPro is a complete FBA inventory management solution, factoring in lead times as well as sales data to provide accurate restock suggestions. RestockPro also allows you to store your supplier information, costs, and local inventory numbers and manage POs and shipments all in one place.
You may think of the SellerPulse Inventory Report as a lightweight inventory management solution, while RestockPro is a better fit for sellers who need a more comprehensive inventory management solution. Some sellers may benefit from using both.
Agencies and consultants may also appreciate the insights provided by SellerPulse without needing the full capabilities of RestockPro. For example, an advertising agency will want to know which products are low in stock before running a new ad campaign. SellerPulse is included in FeedbackFive Agency plans.
What do you think of the new SellerPulse reports? What would you like to see next? Share your feedback here.